In the previous posts, we have discussed Derivatives. If you have not seen that post, you can check it out here. In this post, we will discuss an important term associated with options: volatility.
Volatility in terms of returns is considered to be a statistical measure of the dispersion of returns for a given security or market index. Volatility can be measured by using the standard deviation or variance between returns from that same security or market index. Commonly, the higher the standard deviation, the higher the risk.
In other words, Volatility is the statistical measure of price variability, often expressed as the annualized standard deviation of returns. A market is considered volatile when indices like the Nifty or the S&P 500 swing by more than 1% daily over a sustained period.
For portfolio planning, monitoring both historical volatility (past behavior) and implied volatility (future expectations) is crucial to balance risk and opportunity. Read ahead to know more about these.
Why does volatility matter?
Volatility creates opportunity for traders to profit but also places higher risk. For investors, it impacts portfolio stability and asset allocation decisions. For risk managers. it is an essential input for value-at-risk (VaR), hedging strategies, and stress testing. For options pricing, volatility is a core variable in determining option premiums.
There are several ways of calculating the volatility of a financial security, as we will see going forward.
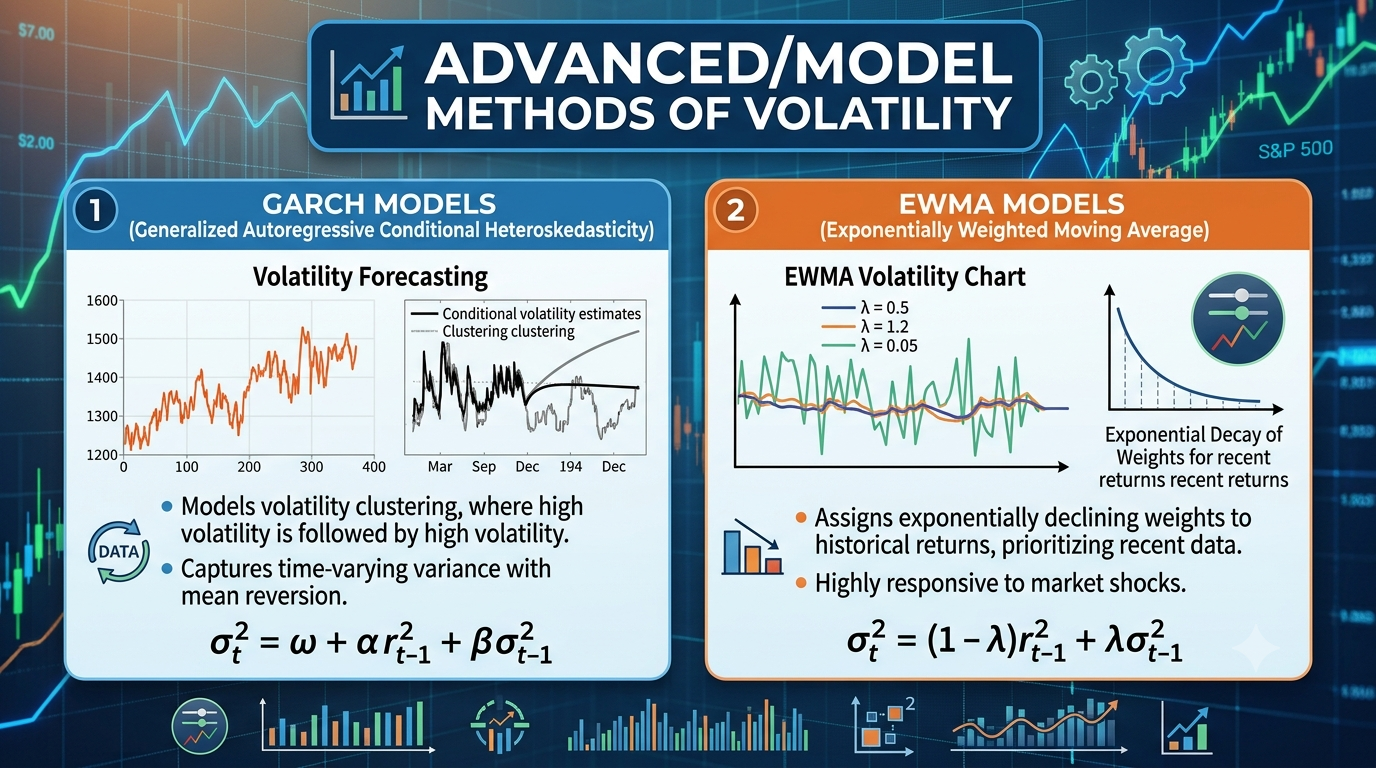
1. Statistical/Historical Method:
a. Standard deviation (Historical Volatility):
- Calculate daily, weekly, or monthly returns
- Compute the standard deviation of those returns
- Higher standard deviation = higher volatility
This is the simplest way to calculate volatility and is widely used. But the drawback is it is backward-looking, and it ignores current market expectations. The best use case for this is stocks and indices with long price history.
b. Variance:
- Similar to Standard deviation but expressed as squared deviations
- Useful in portfolio theory when combining assets
This is also a simple way to calculate volatility. The drawback is it is sensitive to outliers, since it squares the deviation; they have a disproportionate impact on the output.
Example Calculation:
Suppose you have daily returns for a stock:
- Compute mean daily return.
- Subtract the mean from each daily return → deviations.
- Square deviations, average them → variance.
- Take the square root → standard deviation.
- Annualized: multiply by (trading days in a year).
c. Rolling window volatility:
- Compute volatility over a moving window (eg., 30 days)
- Shows how volatility changes over time.
This also calculates standard deviation but over moving time windows. It captures changing volatility regimes. The limitation that it has is its choice of window size affects the results. The best use case for this is short-term trading and regime detection.
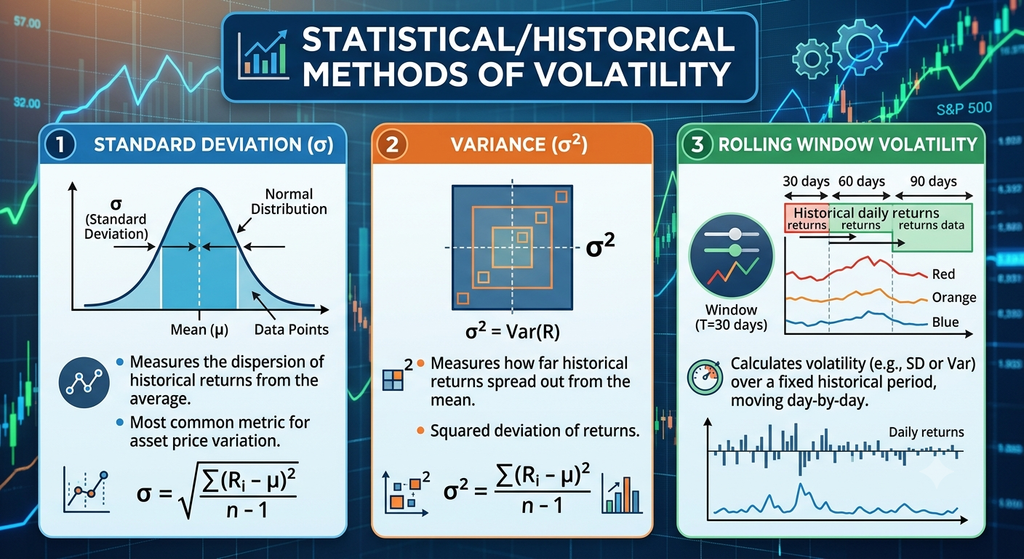
2. Market Implied Methods:
a. Implied Volatility (Options Market):
- Derived from option prices using models like black-scholes
- Reflects the market’s expectation for future volatility
- Commonly used for stocks with liquid options
This is derived from option prices (eg. black scholes). It is forward looking, reflects market sentiments. The limitation is it can’t be applied to every instrument as it requires liquidity of the instrument in the options market, and model assumptions. The best use case is equity options, index options, commodities with active derivatives.
b. Volatility Index (VIX style)
- For indices, volatility indices (such as the India VIX for the Nifty) provide implied volatility directly.
This index is widely followed and is a benchmark for sentiment. But it is limited to specific markets. The best use case is to gauge macro sentiment and hedging strategies. A rising India VIX signals fear and uncertainty in markets. A falling India VIX suggests confidence and stability.
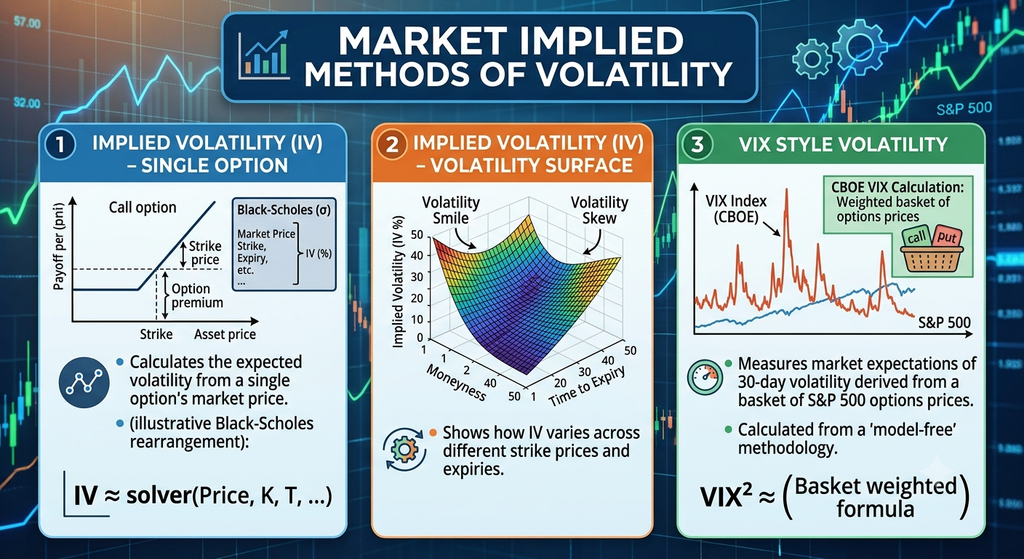
3. Advanced/ Model Based Methods
a. GARCH models (Generalised Autoregressive Conditional Heteroskedasticity):
- Statistical models that capture time-varying volatility
- Useful for forecasting volatility.
This is a statistical model for time-varying volatility. It captures clustering and persistence. Its limitation is that it is complex and parameter-sensitive. The best use case is quantitative research and risk management.
b. EWMA (Exponentially Weighted Moving Average):
- Weights recent returns more heavily.
- Provides a smoother, responsive volatility estimate.
4. Practical Investor Tools:
a. Look at Beta (systematic volatility vs. market):
Beta > 1 means more volatile than the market. Its core idea is sensitivity vs. the benchmark index. It provides easy comparison across assets. Its limitations are only relative, not absolute volatility. The best use case is portfolio diversification and equity analysis.
b. ATR (Average True Range):
Technical indicator measuring daily trading range volatility. It measures the daily range (high-low-close). It is used for trading signals and stop loss placement. Its limitation is that it is not annualized and is less common in institutional finance. The best use case is technical trading, commodities, and FX.
Volatility screens on platforms
Many trading platforms (like NSE/BSE analytics, Bloomberg, Screener) provide historical volatility metrics.
| Method | Core Idea | Strengths | Limitations | Best Use Case |
|---|---|---|---|---|
| Historical Volatility (Std. Dev.) | Standard deviation of past returns | Simple, widely used, easy to compute | Backward-looking, ignores current market expectations | Stocks, indices with long price history |
| Rolling Window Volatility | Std. dev. over moving time windows | Captures changing volatility regimes | Choice of window size affects results | Short-term trading, regime detection |
| Implied Volatility (Options) | Derived from option prices (e.g., Black-Scholes) | Forward-looking, reflects market sentiment | Requires liquid options market, model assumptions | Equity options, index options, commodities with active derivatives |
| Beta (Relative Volatility) | Sensitivity vs. benchmark index | Easy comparison across assets | Only relative, not absolute volatility | Portfolio diversification, equity analysis |
| Average True Range (ATR) | Measures daily range (high-low-close) | Useful for trading signals, stop-loss placement | Not annualized, less common in institutional finance | Technical trading, commodities, FX |
| GARCH / EWMA Models | Statistical models for time-varying volatility | Captures clustering, persistence | Complex, parameter-sensitive | Quantitative research, risk management |
| Volatility Indices (e.g., VIX) | Market-implied volatility index | Widely followed, benchmark for sentiment | Limited to specific markets (S&P 500, etc.) | Macro sentiment, hedging strategies |
As a general thumb rule:
If you want simplicity → Historical Std. Dev.
If you want forward-looking → Implied Volatility / VIX.
If you want dynamic modeling → GARCH/EWMA.
If you want trading signals → ATR.
This is all for this post. Don’t forget ot follow my Facebook and Instagram pages for regular updates. Hope you got to learn something new. See you all in the next post. Till then, keep learning.